
Screening Companies
By Len In GeneralAnalytics as the core innovator of business processes amazed us once again in the recent NRF Convention and Expo in New York, where a Virtual Reality Experience had been showcased to exhibitors.
This newest technology displayed a demo on big flat screen to users where they can get the full experience of navigating a retail store’s products showing details on sales, demand, turnover, discounts and other segments about the inventories displayed in it.
Though it was still a prototype, this indicates that sophisticated virtual store is not really far from reality. Imagine of owning a virtual store where you don’t need to depreciate the building, machines and equipment installed in it, but rather appraise your virtual store’s growing market value.
With this in mind, let XBRLAnalyst help you on your considerations in adapting innovations – cost vs. benefit. Though VRE is still on its developing stage, any related innovation with the probability of disposing some Property, Plant and Equipment (PPE) should consider “Depreciation” as the first cost to be saved.
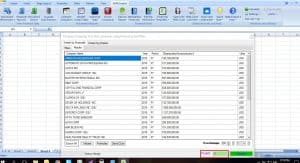
Let’s start by screening all publicly listed companies with the highest depreciation expense disclosed on year 2015, with minimum amount of $100M. Companies with high depreciation expense most likely to consider PPE disposal in exchange of technological advancement.
- Use “Screen Companies”, to search for “DepreciationNonproduction” account. By using a defined US-GAAP account “DepreciationNonproduction”, XBRLAnalyst will not include those companies which are allotting some of depreciation expense on its production, which form part of Cost of Sales (COGS). This is due to the notion that only non-productive PPE can be disposed without direct effect on income generating business operations.

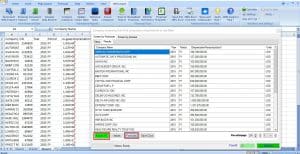
2. We found 30 companies which reported at least $100M on their 2015 statements.
3. Export all data including the “Formula” to allow tracing back of each value into its related documents.
4. The list generated can be easily customized by using Excel. And by adding general information code such as “SIC Code or SIC Description” to XBRLFact function, you can further screen the companies by their Industry sectors, as per attached template.
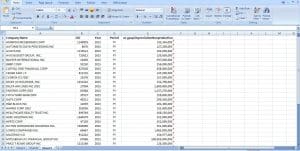
5. After ranking these companies, you can now analyze each company’s “Depreciation” account and how much can be saved if some non-productive PPE will be discarded. Visualizing overall company status and performance thru chart and graphs can also be completede using XBRLAnalyst.
Indeed, XBRLAnalyst’s “Screening Companies” and XBRLFact function are a perfect combination on filtering companies along with their GAAP and non-GAAP metrics, to generate a simple but integrated financial reports.
No Comments