Analyze Soft drinks stocks for investment
Performed with XBRLAnalyst for Excel
Summary
Based on our comparative and fundamental analysis in XBRLAnalyst, Monster Beverage Corp (MNST) stock has a great potential for investors:
- Stock value growth is 56% over a period of the last three years.
- Gross Profit Margin is 58%
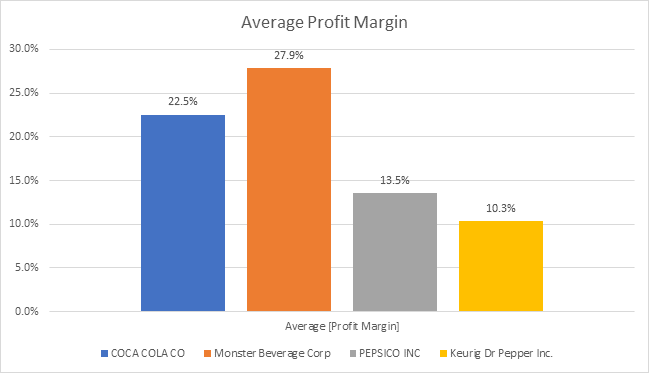
- Profit margin is 28% which keeps it at the top of the list.
- Net working capital shows a solid liquidity basis, strong operational efficiency, and ability to meet short-term obligations as compared to its competitors.
- In the absence of long-term credit risk (Total Debt to Equity = 0%), ROE (Return on Equity) ratio is 9% which is quite interesting for prudent investors.
- Possibility to capture larger market share (see market capitalization graph) as it has can bit its competitors by business and financial performance.
Introduction
In 2021, the US expected one of the world’s largest carbonated soft drinks market, generating about $153.5 billion of revenue. Annual growth rate is forecasted 4.13% during the years 2021-25. Per capita consumption will remain 155 liters in this current year. (ref.1).
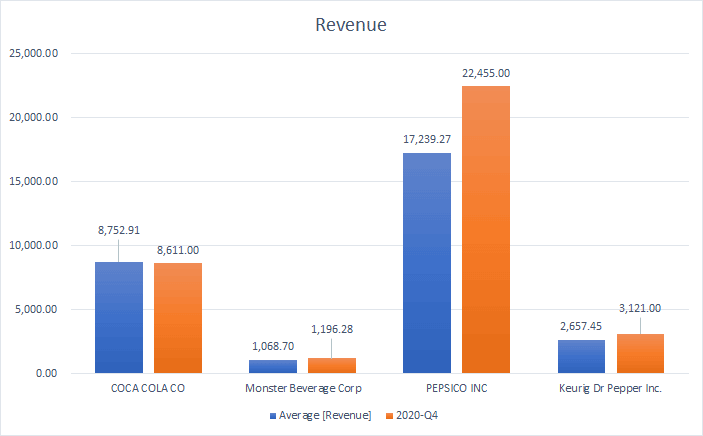
Top US beverages companies by revenue during the last quarter of the financial year 2020 was as below:
- Pepsico — $22.5 billion.
- Coca Cola — $8.6 billion.
- Keurig Dr. Pepper — $3.1 billion
- Monster Beverage — $1.2 billion.
XBRLAnalyst: =FinValue(“PEP”,”[Revenue]”,”2020-Q4″,,,”bln”)
Financial Data to check before buying Stocks
Portfolio Quarterly Analysis:
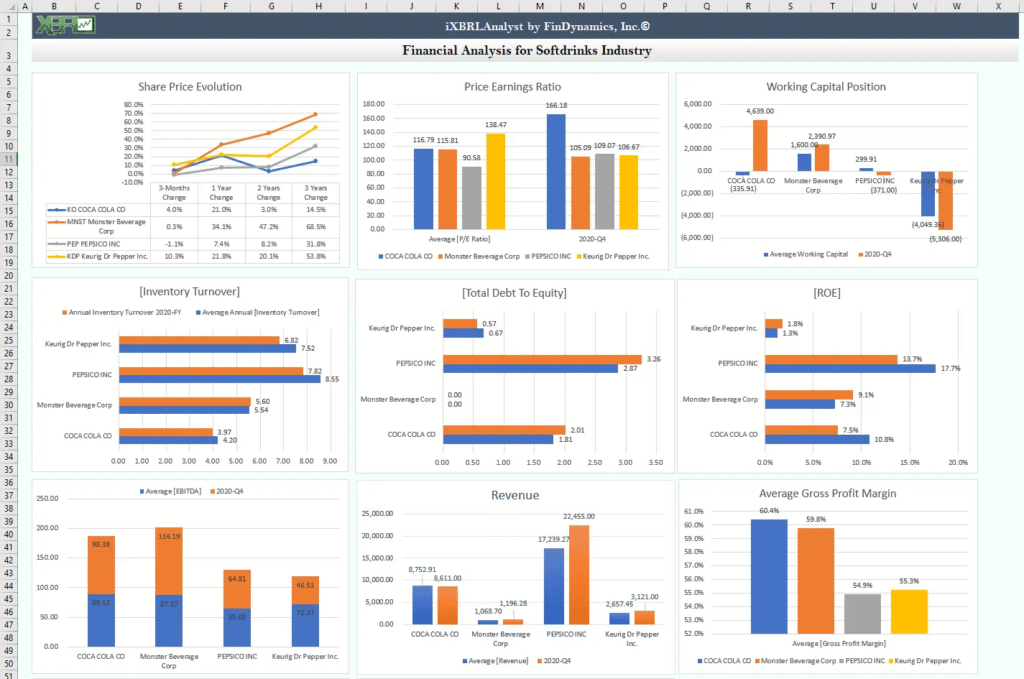
According to the result indicated in the table “Share Price Evolution” of Excel Model, it is evident that the share value has been increased by 56%, 48%, and 27% in favor of Monster Beverage, Dr. Pepper, and Pepsico respectively over a period of last 3 years. Surprisingly, all the stock values have been decreased (from 1.5% to 4.6%) except for Dr. Pepper which has gained 7.4%.
XBRLAnalyst: =SharePrice(“KDP”,”4/2/2021″)
Market Capitalization:
Coca-Cola and Pepsico are dominating the carbonized soft drinks industry in the United States. They have invested 236.3 (KO) and 200.1(PEP) billion dollars respectively according to the last quarter of the financial year 2020.
XBRLAnalyst: =FinValue(“KO”,”[Market Cap]”,”2020-FY”,,,”bln”)
Liquidity Position:
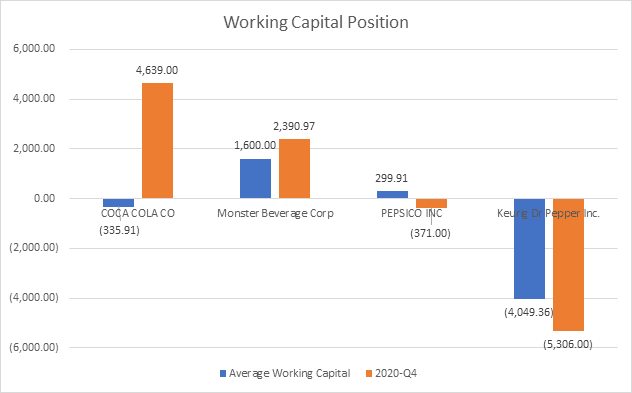
As per the data and graph available on net working capital, the liquidity position, operational efficiency, and short-term financial obligations of the major beverage companies are rather delicate. The normal yardstick for this financial indicator should be in positive figures. Average net working capital is in negative figures for Coca-Cola and Dr. Pepper. For the last quarter of the year 2020, Net Working Capital for Pepsico is also negative. Monster Beverage is the only company in this category that is showing positive working capital continuously over a period of the last three years. This indicates the sound liquidity and operational efficiency of the company. Moreover, this also demonstrates its capacity to meet short-term financial obligations.
XBRLAnalyst: Working Capital =FinValue(“PEP”,”[Current Assets],”2020-FY”,,,”mln”) minus FinValue(“PEP”,”[Current Liabilities],”2020-FY”,,,”mln”)
Profitability Aspect:
The average gross profit margin in the soft drinks industry is high ranging from 55 to 60 percent. The top performers under this financial indicator are Coca-Cola and Monster Beverage having a gross profit margin of 58% each during the last quarter of the financial year 2020.
Operational efficiency is evident from the net profit margin figures of Monster Beverage company. Although Coca-Cola and Monster Beverage have the same percentage of gross profit margin when it comes to net profit figures, Monster Beverage gained 39% as compared to Coca Cola which is 17% during the last quarter of the year 2020. Even based on the average profit margin, Monster Beverage (28%) is making 5% more profit than Coca-Cola (23%).
XBRLAnalyst: =FinValue(“MNST”,”[Gross Profit Margin]”,”2020-FY”,,,)
Risk and Reward Assessment:
Average Return on Equity (ROE) is high for Pepsico (18%) and Coca-Cola (11%) which can be explained by the average high total debt to equity ratio (2.9) and (1.8) respectively. A higher amount of debt can increase the company’s profit margin and ultimately more funds available for distribution among the shareholders. But at the same time, the credit risk associated with such type of investment strategy can also not be ignored.
XBRLAnalyst: =FinValue(“KDP”,”[ROE]”,”2020-FY”,,,)
In this relationship, Monster Beverage is performing exceptionally well because the total debt to equity ratio is zero percent which means the credit risk is at its minimum level. But at the same time, the average return on equity ratio is 7.3% over a period of the last three years and it was 9% during the last quarter of the financial year 2020 which is reasonable.
XBRLAnalyst: =FinValue(“KDP”,”[Total Debt To Equity]”,”2020-FY”,,,)
Inventory Turnover:
According to the data available for the inventory turnover, most companies show pretty good performance in this regard. The standard range should remain from 5 to 10 for most industries. In this category, Coca-Cola is the only company that has an inventory turnover figure of 4.2. This may be due to weak sales or excessive inventory. In this case, overstocking can be the reason for this low inventory turnover as compared to its competitors. Although Inventory turnover is a financial ratio that depends on line items reported in the disclosures to financial statements, XBRLAnalyst allows loading that in Excel with simple built-in formulas.
XBRLAnalyst: =FinValue(“KO”,”[Inventory Turnover]”,”2020-FY”,,,)
Valuation:
The low Price to Earnings ratio is another indicator to evaluate the market stock price as compared to the revenue it generates. Pepsico is the company that needs to be observed because its stock price is low as compared to its earnings. It is evident from the low PE ratio when compared with the average figure for the soft drinks industry. Average PE ratio for this category is 115.4, hence Pepsico having a PE ratio of 90.6 should clearly be the choice based on this financial metric.
XBRLAnalyst: =FinValue(“PEP”,”[P/E Ratio]”,”2020-FY”,,,)
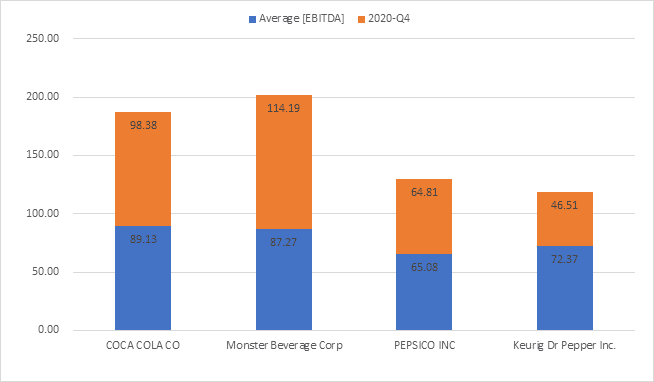
Enterprise Value/EBITDA (46.5) is in favor of Dr. Pepper which is on the lower side when compared with its industry average figure (78.5).
XBRLAnalyst: =FinValue(“MNST”,”[Enterprise Value]”,”2020-FY”,,,”mln”) divided by =FinValue(“MNST”,”[EBITDA]”,”2020-FY”,,,”mln”)
Valuation Conclusions
We analyzed in Excel some important financial metrics and financial statements of several leading Soft Drinks companies. That financial data combined with the stock prices should always be checked before buying stocks. Such analysis that is normally performed by a professional Financial data analyst is now simplified and fully automated with XBRLAnalyst.
Our calculations presented in this report can be and reviewed in the provided Excel model. One can download that Excel file and easily extend the list of stocks benchmarked in this report. With XBRLAnalyst, the stock prices and the data from the financial statements and disclosures will be automatically loaded in corresponding Excel spreadsheets while the graphs will be updated on the main Dashboard.
Based on the analysis of their stock prices, latest reported revenue, working capital, Gross and Net Profit Margin, Market Capitalization, P/E ratio, and Inventory Turnovers as well also some other metrics summarized in the Excel report, we concluded that Monster Beverage Corp (MNST) stock may present a great opportunity for growth investors as compared to other companies in our Comparative analysis.
If you are an educated investor who cannot afford expensive platforms such as Bloomberg for stocks market or Factset and you don’t want to spend time manually sourcing data from Yahoo financial data platform or from Google stock market feed, simply subscribe to our LiTE plan and get all that financial data in Excel automatically using iXBRLAnalyst for browser or XBRLAnalyst for Excel on Windows OS.
DISCLAIMER: NO INVESTMENT ADVICE
The content available on or through the https://findynamics.com/ website (“Content”) is for informational purposes only, you should not construe any such information or other material as legal, investment, financial, or other advice. Nothing contained on our Site constitutes a solicitation, recommendation, endorsement, or offer by FinDynamics, Inc. or any third party service provider to buy or sell any securities or other financial instruments in this or in any other jurisdiction in which such solicitation or offer would be unlawful under the securities laws of such jurisdiction.

