
Analyze financial data in Excel with XBRLAnalyst
|
Visualize XBRL tag data in Financial Statements

XBRLAnalyst visualizes how a company reported XBRL tag data starting with the first filing. Dash line over missing points helps understand when company started using XBRL tag and for what periods.
Review anomalies or amendments in company XBRL reports

With XBRLAnalyst, you can easily review anomalies or amendments in XBRL report data using powerful Excel templates. See how XBRLAnalyst tracks Revenue and Profit changes for Fortune 500 companies.
Drill down to dimensional information

Double-click any account on Financial Statement in Excel and review, plot, export financial details disclosed in the footnotes, e.g. business segment revenue information or debt structure.
Automate monitoring the changes in financial data

XBRLAnalyst adds new functions in Excel for automatically loading and updating XBRL data from the most recent and historical XBRL reports. Automate your YoY analysis.
Search industry/companies that use specific XBRL tag
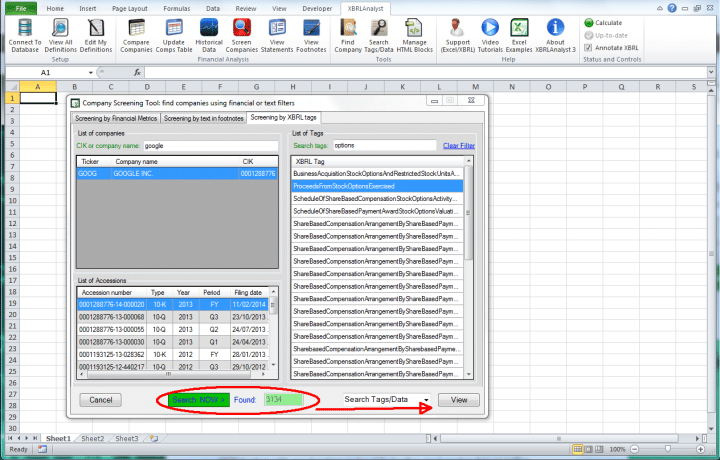
Use XBRLAnalyst Screening tool for searching all companies that use specific XBRL tag. Review the dimensional information and values linked to the tag.
Try XBRLAnalyst for free and see it yourself!
Free 15-day trial
Enjoy instant access to XBRL data in Excel.