
Discounted Cash Flow
By xbrlanalyst In GeneralWe have been checking around for something to analyze with XBRLAnalyst. Then, we stumbled on this article suggesting of some valuable investments to start with. Of course, we geared up and quickly started a futuristic approach that we think might be helpful to our investors decide if these stocks are really worthy of their hard-earned money and retirement pay.
Since we are hopefully getting the attention of our dear senior citizens (as per the article), we will be getting the present value of the future returns by one of the suggested companies “CVS” by using Weighted Average Cost of Capital (WACC) and Discounted Cash Flow (DCF).
Using XBRLAnalyst, easily return the required values for your WACC computation by using Historical Data or pulling data thru XBRLAnalyst functions. For CVS, we retrieved data from 2011-2016, visualized results on a column chart and linear trendline. So far, its historical operating cash flow is pointing towards a positive direction:

By using this historical cash flow trend, we will then build our forecasted cash flows, using both straight-line and compounded methods. As you would notice below, the two methods have opposite results:
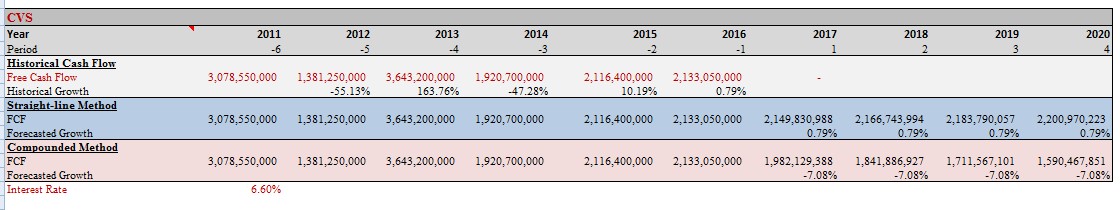
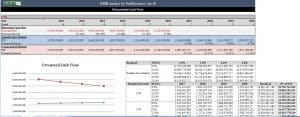
To get a better view, lets put them into chart too. As shown on below trend, both methods are somehow suggesting that in few more years, they might be meeting at a certain point. Well, if you want to know what year that would be, just extend the periods included in this analysis for 5 or even 10 more years. As a matter of fact, Historical Data can pull up to 20 periods into one report.

And since the article is suggesting to invest on this stock now, we also calculated residual growth and present value of its future cash flows. As shown on below table, we set some residual growth percentage using the results we generated from our WACC and DCF computations:

This present value of FCF report is for straight-line method only. To calculate for compounded method, use the data presented in our free cash flow table. Just change the Ticker on this free excel template, provide some required data, and it will automatically calculate present values of your future investments.
All of these can be easily created using XBRLAnalyst in Excel. We have been providing analysis tools to our clients for years and continuously developing our system to cater all financial analysis requirements. You might also want to check our Mutual Funds’ Risk and Return Reports and IFRS Data set to get along with our latest developments. Download now our free trial or check our free Google Sheets templates using our online version iXBRLAnalyst.
If you would like to try XBRLAnalyst for Excel or iXBRLAnalyst, just register for a test drive (no Credit Card required!)
If you need assistance building Excel models that leverage XBRLAnalyst tools, contact us at support@findynamics.com.
For video tutorials, visit our website or subscribe to our Youtube channel. To follow our posts and updates, please add our Twitter and Facebook accounts. For more information, please consult our Knowledge Base.
No Comments